試做:使用 N(172, 5)模擬 100人身高、使用 N(58, 5)模擬 100 人,繪製 X-Y 散佈圖
XY 散佈圖是指:
XY 圖的基本形式是以一個資料數列為基礎,而這個資料數列包含名稱、X 軸值清單以及 Y 軸值清單。每個值配對 (x|y) 在座標系統中都會顯示為一點。
學習目標 透過 R 軟體畫出 XY 散佈圖。
語法 1 2 > weight <- rnorm(100, 58, 5) > height <- rnorm(100, 172, 5)
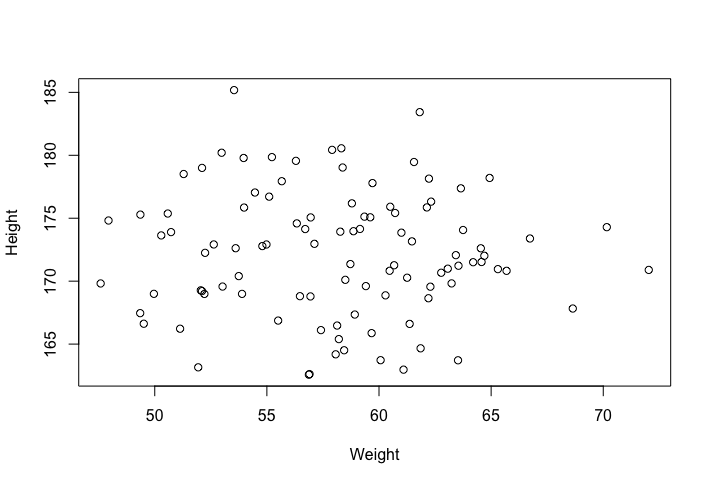
接著畫出身高體重的 XY 散佈圖
1 > plot(weight, height, xlab="Weight", ylab="Height")
結果
線性迴歸分析 height 為「被解釋變數」
1 > summary(lm(height ~ weight))
結果
1 2 3 4 5 6 7 8 9 10 11 12 13 14 15 16 17 Call: lm(formula = height ~ weight) Residuals: Min 1Q Median 3Q Max -9.6905 -3.3894 0.0386 3.0392 12.8012 Coefficients: Estimate Std. Error t value Pr(>|t|) (Intercept) 174.28142 5.72277 30.454 <2e-16 *** weight -0.03555 0.09803 -0.363 0.718 --- Signif. codes: 0 ‘***’ 0.001 ‘**’ 0.01 ‘*’ 0.05 ‘.’ 0.1 ‘ ’ 1 Residual standard error: 4.955 on 98 degrees of freedom Multiple R-squared: 0.00134, Adjusted R-squared: -0.00885 F-statistic: 0.1315 on 1 and 98 DF, p-value: 0.7176
迴歸分析 F 檢定 p-value = 0.7176
參考
IBM Lotus Symphony 圖表類型:XY(散佈)圖